Appendix F | Geographic Breakdown of the AIAT Market
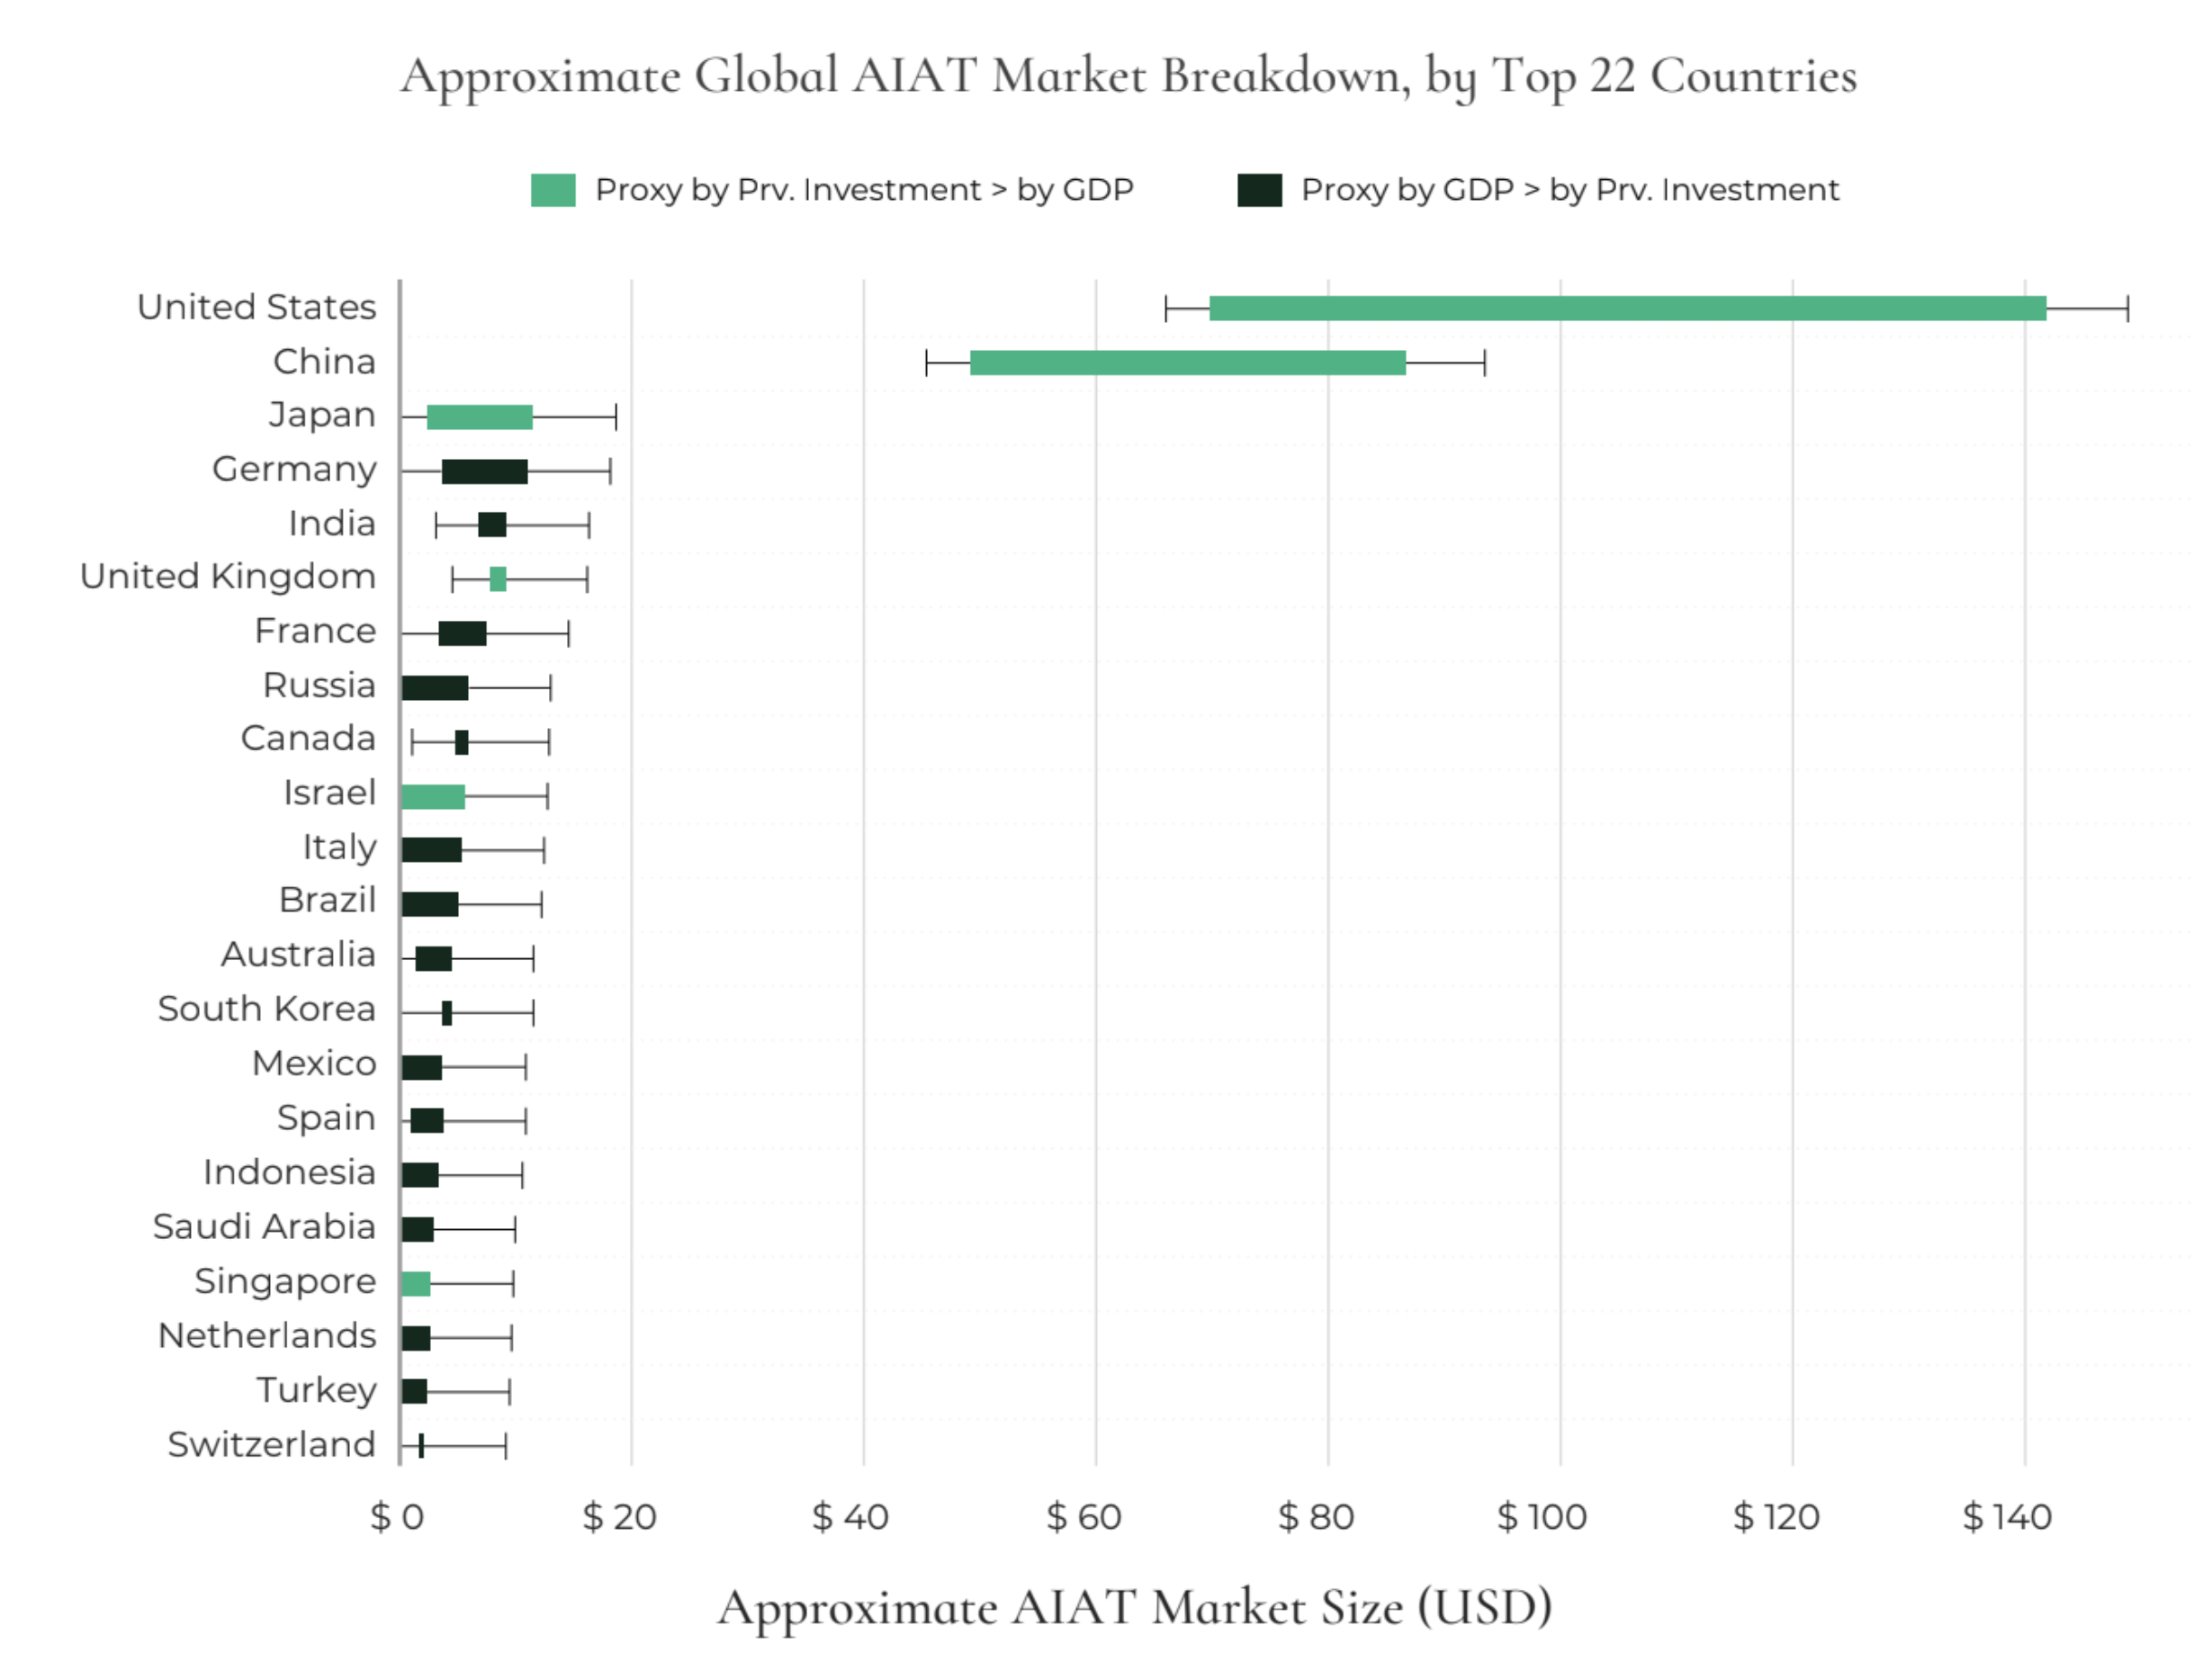
Readers may be interested in a country-specific figure for the AI Assurance Technology market. While our modelling does not consist of country-specific data, we can—by proxy—generate estimates for the top countries. The below graph was created by allocating our 2030 AIAT forecasts in proportion to:
- The share of private AI investments made in each country.
Source: Stanford University. "HAI AI Index Report 2023." Stanford Human-Centered AI Institute, April 2023. Accessed April 19, 2024. https://aiindex.stanford.edu/wp-content/uploads/2023/04/HAI_AI-Index-Report_2023.pdf
- Current estimates for national Gross Domestic Product (GDP).
Source: Worldometers.info. “GDP by Country - Worldometer.” Accessed March 29, 2024. https://www.worldometers.info/gdp/gdp-by-country/.
Both approaches result in the following chart, where the size of the bar represents the difference between the two methods. As one might expect, the US and China appear to be the leading AIAT markets, by far. Beyond that, India, Japan, the UK, Germany, France, and Canada, are consistently among the top ten countries in both approaches. While these figures are imperfect approximations, they may help to regionally apportion the total addressable market size in specific countries of interest.